Interview with Nara Oliveira, Free Software Artist
GIMP is Free and Libre Open Source Software, but none of it is possible without the people who create with and contribute to it. Our project maintainer Jehan wanted to interview the volunteers who make GIMP what it is, and share their stories so you can learn more about the awesome people behind GIMP!
Early interviews from co-maintainer Michael Natterer and Michael Schumacher were published shortly after the first Wilber Week. The remaining interviews from this event, about Simon Budig and Øyvind Kolås were published years later as a revival of the series. While these interviews are a bit old and reference outdated versions and features of GIMP, we believe they still have value and show the evolution of our community.
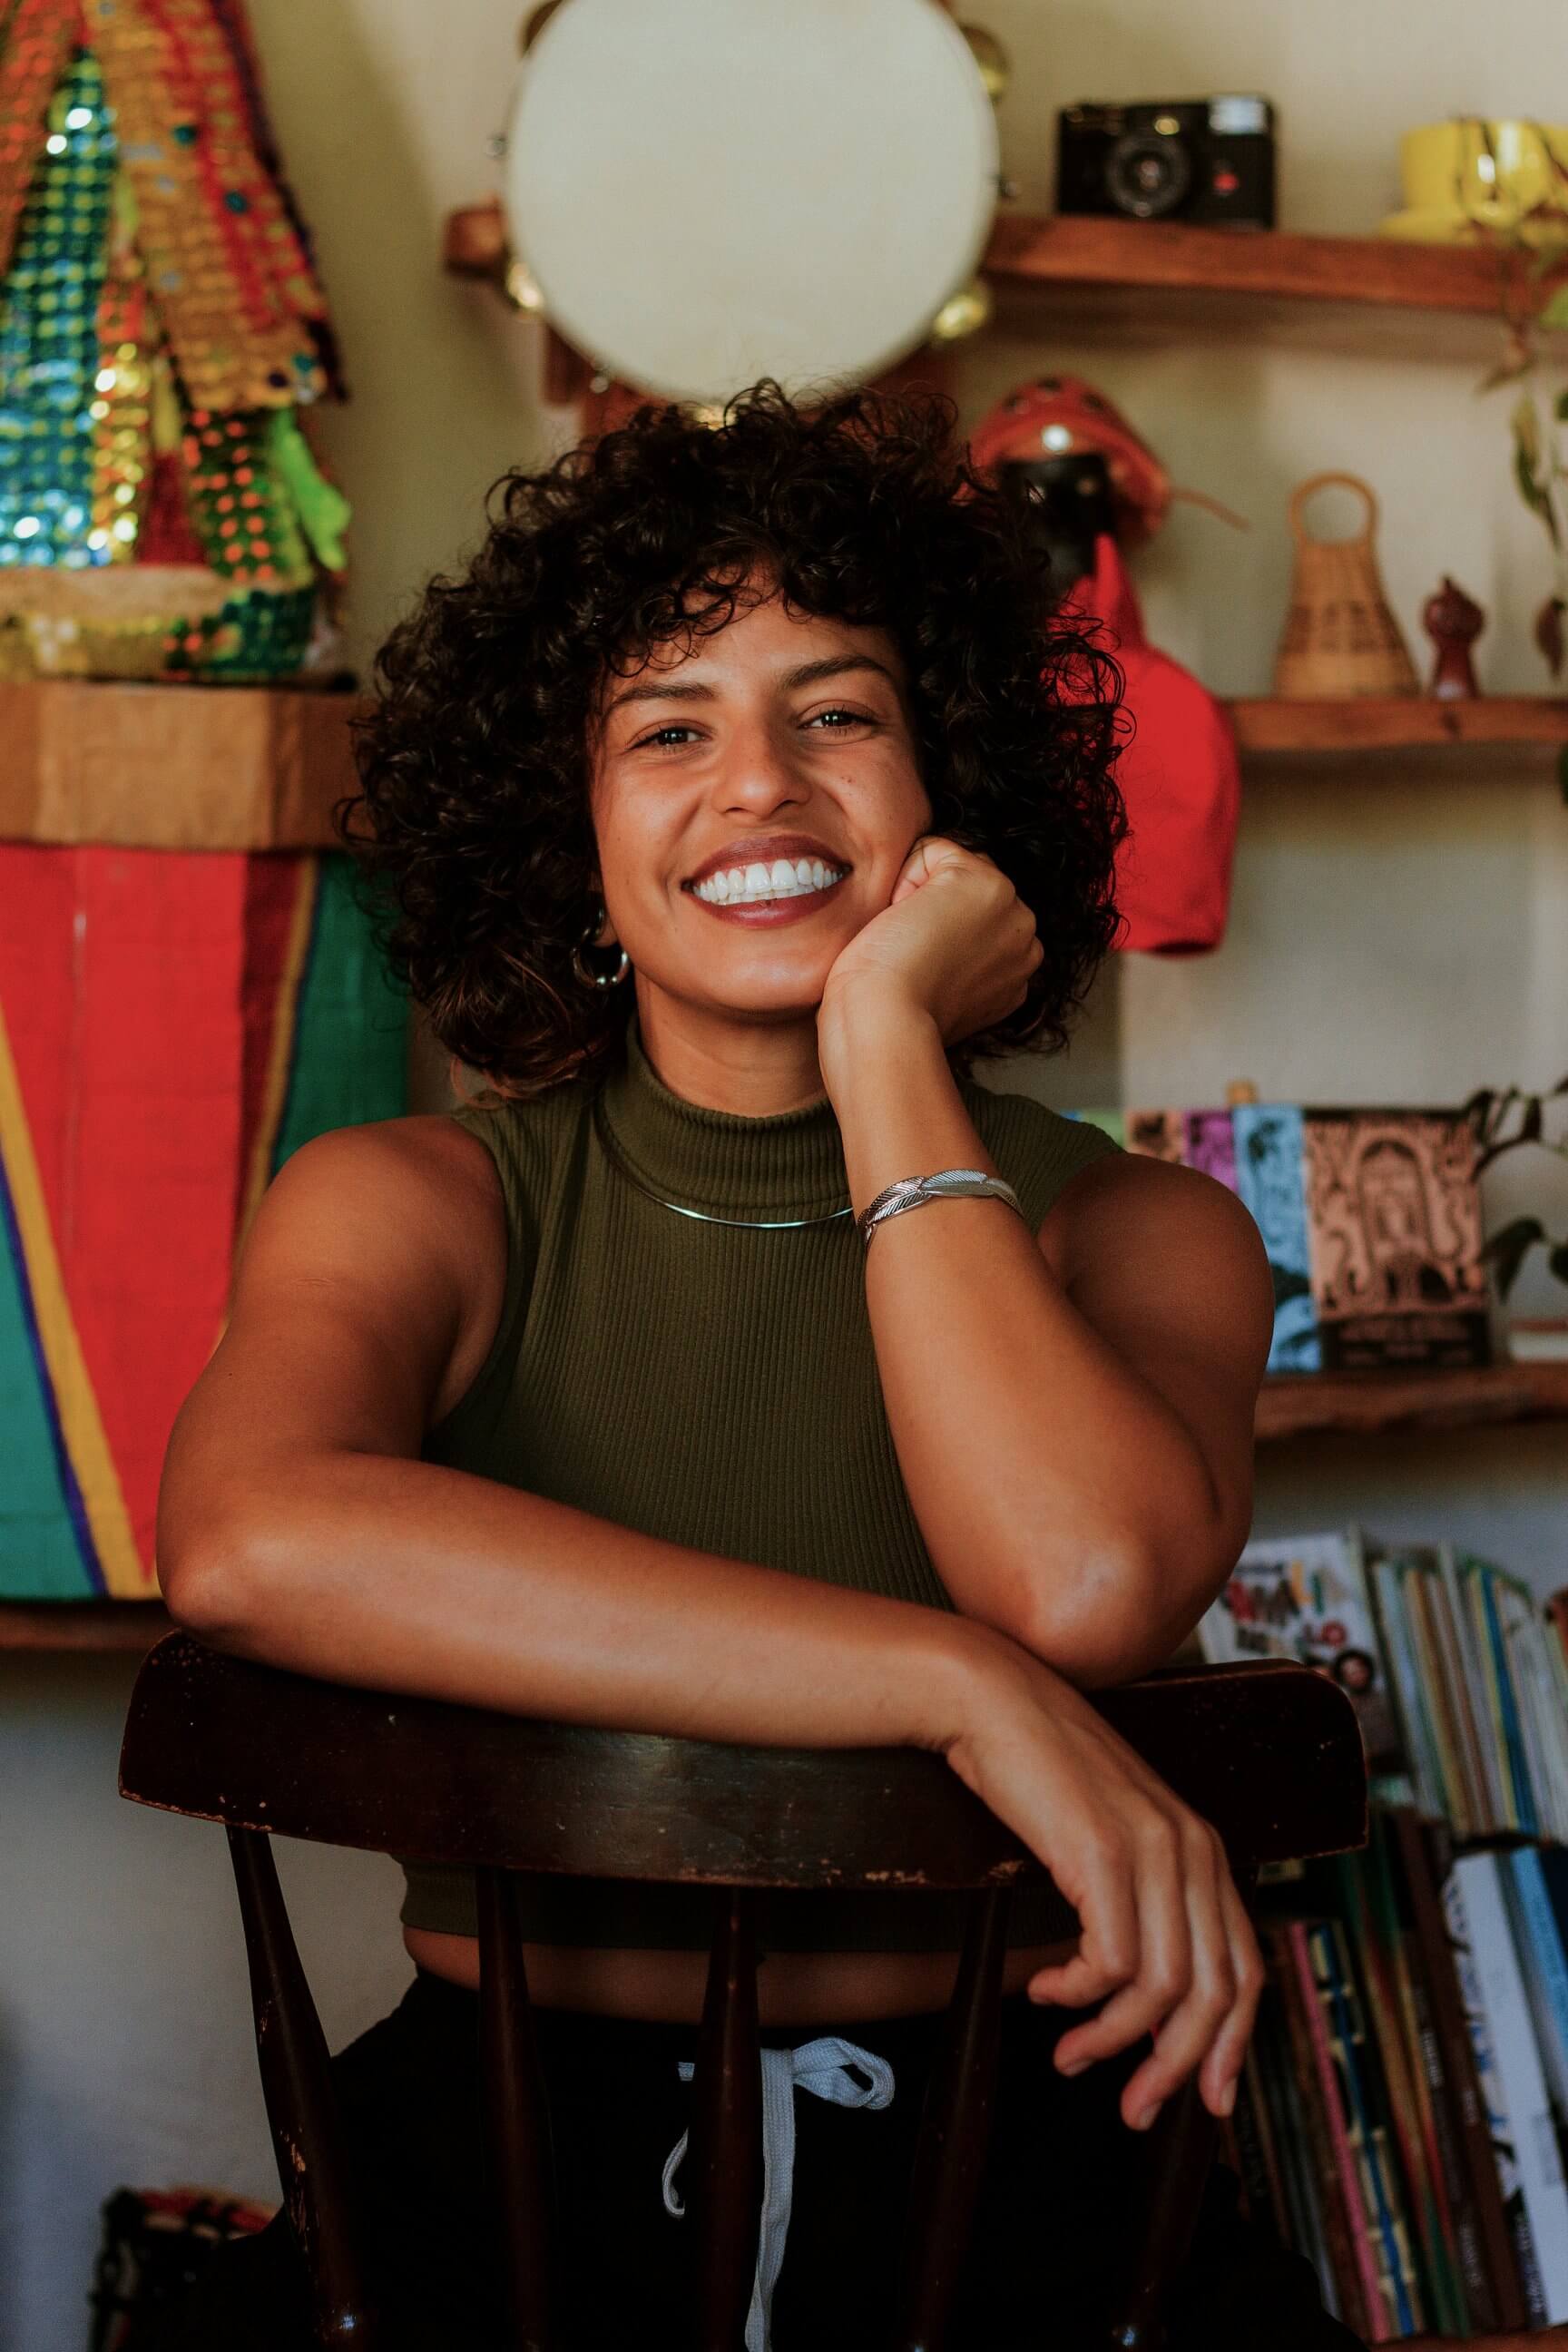
This next interview is the first one recorded at the 2017 Libre Graphics Meeting in Rio de Janeiro, Brazil. The subject is Nara Oliveira, co-founder of Estudio Gunga. She is a Brazilian artist and advocate who uses free software exclusively to develop professional works in many fields, including design, illustration, and animation.
This interview took place over April 21 - 23, 2017. In addition to Jehan and Nara, Simon Budig, and Aryeom Han were also involved and asked questions.
Jehan: Hello Nara. Can you introduce yourself to the people?
Nara: My name is Nara Oliveira. I am a Brazilian designer. I am from Brasília, the capital. The city name is Taguatinga. I study design and today I work with free software. I have my own company with some partners and we work in audio, video, design, and animation.
Jehan: What is the name of your company?
Nara: Gunga. Gunga is an instrument from Capoeira. We have the berimbau with the “calabash”, I think – it’s an instrument from Capoeira.
Jehan: Okay. From what we understood, you mainly use free software
Nara: Yes.
Jehan: Mainly, or only?
Nara: Only.
Jehan: And which ones in particular?
Nara: I use GIMP, Inkscape, MyPaint, sometimes Krita – I’ve tried it – Scribus, FontForge, FontMatrix, and others like everybody uses.
Jehan: Do you use Linux?
Nara: Yes, Arch Linux.
Jehan: So full free software from start to end! Okay, and why do you do this?
Nara: When I heard about free software and Linux, I was working in a cultural space. I was working with theater and with drawing, and we already have that culture of sharing things and sharing knowledge. So when I met these guys in free software, they told me about what GNU and Linux were and the philosophy – and when I heard about it I fell in love with it. Because I already think that way, and so free software is applying what I think is right onto software and onto technology. So for me it just makes sense.
So I started to use this software. In the beginning it was difficult to make the transition, but with some time I got into it.
Jehan: So you made a transition from proprietary software?
Nara: Yes, from proprietary software to Linux.
Farid: When was this?
Nara: When? Ah, let me count…
[group laughter]
I was not finished studying then, so like around 2006 or 2007 I started. I really started to use Linux and everything for working in 2008, for everything.
Jehan: So you studied design in university?
Nara: Yes, in university.
Jehan: With proprietary software?
Nara: Yes, with proprietary software only. But my university was not so focused on software. In five years of studying, we only had one class about software. And as the class went on, everyone already knows how to use it! So it’s like a class that has to be on the curriculum, but it’s not like you have to use – it’s more like conceptual.
Simon: Something I do a lot is that - I’m a software developer mainly, so I do a lot of my own tool development. Like I have a specific problem and I know there is an algorithm in my mind that I know would solve the problem (or might solve the problem), so I start implementing my own tools for very specific, very weird tasks, because I can’t do it with GIMP.
Nara: I would like to do that!
Simon: So this is what I wanted to ask – do you have programming experience? Do you have an idea of what it means to develop software?
Nara: No, but I think I have an idea – but I do not develop programs. I’ve studied a little, but it’s not like I can do something. I can see the code lines and know more or less what’s happening, but I can’t write lines by myself.
Jehan: You’ve told me that sometimes you will see some scripts and guess what it can be, and change the numbers…
Nara: Yeah, but more in insights and not in the programming itself.
Jehan: Since we’re doing this interview for gimp.org, what can you tell us about GIMP? How do you like it? How do you hate it? Tell us everything!
Nara: [Laughing] The first thing is, I like GIMP. I use it a lot. My work and style is more vector, but I use GIMP a lot and I like it.
When I made the transition to free software, until today one thing I didn’t like is that you don’t see the effects. You have do something, turn back, “Oh no!” - I have to change two, three points here, then I have to undo and do it again and come back. For me, it’s one of the things that makes the work not fluid.
I’m so happy to see GEGL on-canvas effects.
[Editor’s note: This feature was already implemented in the development version of GIMP 2.10, officially released about a year after this interview.]
Jehan: So, some other comments on GIMP?
Nara: Yeah, I really like it but, for example, I have some problems with my tablet. When I bought my first tablet, it simply didn’t work on GIMP. And I think it’s because of that, I use MyPaint. Because I have to work, and I have to work right now and the pressure doesn’t work, so what can I do with my tablet – so I found MyPaint, and I started to work with MyPaint, and it’s because of that I use it. Not because I think it’s more powerful than GIMP – it’s just because of that. At the time I liked it, and today I still use it.
[Editor’s note: GIMP 3.0 improved many issues with tablet support that were mentioned here.]
Jehan: So MyPaint is your main software?
Nara: For drawing, yeah. Because I am a designer, but I’m an illustrator too. So for illustration I use MyPaint, just for that. For small drawings, I use vectors in Inkscape, and so on.
I use GIMP more for photos, for editing, composing, correcting photos.
Jehan: Yesterday when we spoke, you had this nice example of a job you did with Scribus. Like your first job with free software, I think?
Nara: No, my first book.
Jehan: Ah, your first book, not your first job with free software. Could you tell it again, now that we’re recording?
Nara: I was called on to make a big book, like three hundred pages. There was little time to do it, like three, two weeks. I am from Brasília, and they said you have to do it here with us to get it quicker. I traveled to Bahia to do it, and when I arrived there, there were two other designers. It was funny because I worked in Scribus, one worked in Corel Draw, and the other one in InDesign. So you had three designers, three different software.
Jehan: And three different operating systems.
Nara: Yeah, and three different operating systems, and we had to do one book, the same book!
So we met each other and said “Okay, let’s do it!”. We separated the book into pages, so I would do the first one to 100, the other designer would do 101 to 200, and so on. And we together figured out how the design of the book would be, and the rules to make each part feel like the same book.
So we started, and just like that, I finished first! I was worried, because I had not used Linux for too long, and if there was something wrong in the software or in the distribution, I would not know how to fix it. One of the designers had Mac and the other had Windows and I was so worried.
But it went well and I finished first – and it was very encouraging for me. It’s just a tool you know? I can do it, he can do it, she can do it – everyone can make it, so I was very happy. Because in the beginning I was worried about everything going wrong, and that there would be problems when I saved the PDF and printed it, but it was all okay.
The book was about experiences with, we call it here “apprentice to Griô”. It’s from the French language, because it came from Africa but a country that speaks French.
It’s like an old master who teaches the people around them, the community, something – knowledge about herbs, which can be medicinal herbs, or teaches about techniques about how to construct instruments, or make music, or dancing – like masters of Brazil, of all Brazil. So it’s because of that it’s a big book!
Years later, in the north of Brazil, when the waters came and filled the houses in the city – a flood. I was seeing that on the TV there was an old lady with her flooded house beside her, everything destroyed. And she had that book in her hand. She was crying because her house was destroyed, but she had the book, and she was happy she still had the book even though she didn’t have her house anymore.
So it was a meaningful project, and it was the beginning of my using Scribus.
Jehan: Are there things sometimes you feel you are not able to do with free software? You already answered this yesterday, so I’m just asking again to hear you saying it.
Nara: When I see art – art is everything, design is everywhere – I can’t see something and think about “I can’t it do with free software”. I can do it – maybe I can’t do it because of my creativity or because I don’t think about it, but technically I can do it, you know. We have the tools to do it. We have other ways, but we have the tools I think – in my area of design.
Simon: What would interest me is, you mention that you use quite a lot of different tools, like GIMP, Inkscape, Blender, Scribus -
Nara: Blender not yet, though I started animating in the timeline. In the movie that we showed, the first one that was in 2D, I animated parts of that.
Simon: But there are a lot of different tools that you and your colleagues use. When you start a project, do you pick one of the tools and stick to it, or is more like you start using one tool then transfer the result to a different tool?
Nara: Yes, it was like each tool was like a room of a house. I live in the house, there’s a lot of rooms, and sometimes I’m in the living room, other times I’m in the bed room, other times I go to the kitchen. It’s like I have a bottle, and I take the bottle here and there.
I don’t choose the software. I plan the project, I think about it, and think “How am I going to make this?” So I will start drawing in MyPaint. But I need it to be a vector, so I save it, open in Inkscape and add a vector. But ah, I need an image in the background. So I open the image in GIMP, I work with the image there, then import into Inkscape, okay. But oh, now I have to print it. So I save what I can save in vector I save in vector, and what I can’t save, I export. And I go to GIMP, transform it and edit it, and I take everything, go to Scribus, put them together, and make a PDF. More or less like this. I’m always going back and forth between the programs.
I think it’s very complicated, but for me it’s very simple. But when I teach things like that it sounds very complicated.
Jehan: Do you have any questions, Aryeom?
Aryeom: I feel like I am in her head. I totally understand – I work the same way. Maybe later if I have any questions I’ll ask.
Nara: I learned everything by myself. So I don’t like tutorials, you know?
Aryeom: You don’t like tutorials?
Nara: Yeah, I don’t have the mind to read or watch them. I learn all by myself. I think my way of working is just my way, because I learn by myself. And sometimes I get in touch with people who use the software too, I like to watch them because people do things very different that I do, and things more easily. And sometimes I teach the software to someone, and in two weeks or three, I go to see what the people are doing. “Oh my God, I’d never think of that way!”. It’s very fun because of this.
I don’t like to do workshops because of that. I think my style of work is very crazy. But we can talk about it!
Jehan: So right now you have a big animation project. So maybe can you speak about it?
Nara: Well, Farid is the director. He writes the script. I am the art director, but I also help him with the script and doing all the storyboards. I do it in MyPaint. I was a little worried because I’ve never done a storyboard before. So I study a little, see other’s storyboards, and make it for the animation. And we are talking with people who want to work with us on the animation – and I was happy because people always say “You have a beautiful storyboard!”. I was worried about that.
I think we are, I don’t know, opening ways. Because we are not a 3D studio but we want to do 3D animation, so we have to contact on a lot of other people in Brazil and Latin America, and even in Europe. It’s been like a dream to make it. And we want to make it very fine, very good, because today if you are seeing bad 3D, then you don’t watch it. Because you have Pixar, you have Disney, you have a lot of others. I don’t think that we’ll be like Pixar, but we have to do something very good and great to be seen, you know? I think this is our goal. We want to make something very nice, very good that everyone wants to see.
We’re telling Brazilian history of Quilombo, when there was slavery. Some slaves ran away and made a tribe, a community of their own and lived there. And these communities survive until today. And some of them have a lot of different cultures. It’s like they’re isolated. And the story is about one of these communities. In Brazil the agriculture is taking the lands of these people, because they have a paper that says “We own these lands”, but actually these peoples have been there for 300, 400 years.
So we are telling the story of a girl who lived in a community like this. And they’re being pressured to go out and leave their lands. The story is a fiction, but it’s based on real facts. This is the history. It’s going to be like 10 minutes, it’s a short one, but it’s a real movie and after it’s finished, we want to continue it. Make like episodes or a long movie – it’s just like a pilot. But we need the pilot to get a bigger step.
Aryeom: I feel so moved, because our ZeMarmot project is also like this.
Nara: Here in Brazil there’s a law, I’m not quite sure, that for free television and private television, 50% of programs have to be Brazilian programs. Because it’s all foreign programs, so the government says that 50% have to be produced here in Brazil. So I have a lot of opportunities in that way for animated series.
Jehan: So you plan to distribute on TV.
Nara: Yeah.
Aryeom: Why did you choose 3D? Why not 2D?
Nara: Because we love it! We really love 3D, we’re really passionate. We started using Blender, even for 2D, but we want to go to 3D you know. We have some experiences, and we like the visuals of the movie – we actually don’t work with 3D, but we want to. A lot of people do that – I think 2D is less expensive and -
Jehan & Aryeom [in unison and laughing]: I don’t think it’s less expensive!
Nara: No? We like 3D. We want to make it – it’s so popular for the kids, for everyone. We want this movie not to go to the festivals and stay there. A lot of good films here are made this way. The very good films go to the festivals, earn their prizes, and no one’s ever seen the movie. “Oh you’ve seen that movie? No!”. It will never go to the cinemas.
We want it to have the chance to become popular, you know, a lot of people really watching it. And 3D has this affection, people really like these.
Jehan: I know you said you also appreciate Creative Common licenses and stuff like that, so is this movie going to be under such a license?
Nara: Yes, it’s going to be an open movie! You can take the characters and make another animation by yourself. If you want to take everything, the characters, the background, everything, and animate another story, you can do this.
Jehan: Which license?
Nara: We haven’t thought about it yet, but the kind of license where you can make anything.
Simon: You said 3D. I sometimes have the impression that 3D in some way is more limited in what you can do artistically compared to 2D.
Nara: Yes, it is.
Simon: So this is not a factor for you?
Nara: No. Because in 3D, it’s like you said. If you’re doing a 2D animation, I don’t know, you can do a lot of types of techniques. Like it can be black & white, it can be color, or so many types – it’s like art in stop motion. 3D is different – you have a character, and you have the scenery, and the scenery is just the scenary. You can make some tricks with lighting and shading and colors, but it stops there. It’s an artistic limitation, I agree with that.
Aryeom: In your team, no one had any experience making 3D animations?
Nara: I animate, but I know how to take the characters and make them move. But I’m not an expert. Farid knows that too and know how to make a 2D animation in Blender. But 3D is a new challenge for us.
Jehan: I think also the question was, you are a designer so you usually work in 2D. So we would expect something who draws would want this drawing to come to life, than just doing the drawing and give it to someone else to make the actual final thing.
Nara: I have difficulties with this. I get tired of drawing very quickly. I can’t imagine myself drawing the same character more than, I don’t know, 10 times. I think I would die if I did that.
Aryeom: Haha, I’m dying!
Nara: It’s like my style. This book was difficult to me, because I had to draw the characters the same. They have to look the same every time I draw it. I don’t like that. I like to do one drawing and it’s over. They have to repeat and be the same. I like the work, but the process of doing the same thing is difficult for me.
Jehan: So you prefer to just draw something and let someone else repeat it again and again.
Nara: Yes, like the computer!
Aryeom: To make a series, an episodic drama, it’s easier to make in 3D. For long form, it’s good I think.
Jehan: Yes, for long form, but for short movies it takes longer due to preparations.
Nara: So it’s not my kind of thing.
[Nara hands out a book]
Nara: It’s by a friend of mine who wrote the story and he asked me to make the drawings. I don’t do a lot of kid stuff, but I like it. And it invites kids to draw at the end of it. It talks about what city do kids want to live in, and what city we want for ourselves. We have a lot of problems in the cities here, and I like the idea of book, to let kids dream about the city because we want that dream to come true.
Aryeom: What about Gunga’s future?
Nara: Ehh, I expect in the future that we have more people working with us. And we have more companies work with us with free software, you know. I’d like to get larger but not too larger. Because I want my life too!
Aryeom: Wise!
Nara: But I’m happy now because last year two new people joined the studio, and it’s a lot more fun to work with more people. We exchange experiences, and I think I want to grow in that way, to get a little bigger and get more partners. And work with more cinemas! It’s more difficult because it’s expensive to work with cinemas, working with animations. We like to do more for ourselves. We make a lot of productions, videos for other companies, for the government, so we’d like to do more for ourselves – like our stories, less for them, more for us.
Jehan: Okay, maybe the last question unless someone has something. Do you have any requests for GIMP developers? Other than on-canvas preview because we already have it!
Nara: I will see the new version you talked about after this.
No, I’m okay. I think I’ve used it for such a long time that I’m so adjusted to it. In the beginning I had a lot of issues – if you gave me a paper then I would fill it with “I want this, I want that! Why do I have this? I can’t believe it!”
But today it is so natural to me that I had to think about it before coming here, because I’ll be meeting people that I want to talk about it with. And I think well, there are little things I want to change in the software. But I think that I have this because I’ve been using it for so long. People are always comparing it with propriety software, and I don’t compare it anymore because it’s been such a long time since I’ve opened something like Photoshop.
So, I’ll think about it.
Jehan: But in the end it just works!_
Nara: Yeah. I’ve written some*, but not for GIMP, for Inkscape, Scribus…
[Editor’s note: Jehan misheard the word “some” here as “song”]
Jehan: Ah! A song for everyone but us?
Nara: I used an earlier version of Inkscape which had a lot of bugs. They just changed it and so I have just bugs for Inkscape. Bugs are bugs.
Jehan: Ah, it’s bugs, not a song!
Nara: Yes, for Inkscape. For Scribus, I have some issues with development.
Aryeom: So you have bugs for them, but you have requests for us. So it’s good!
Jehan: Ah, okay. I thought you’d wrote a song.
Nara: No no – I know my letters are beautiful but it’s not a song.
And I’m happy to meet you! Very happy. I don’t go to a lot of events like here in Brazil. I don’t have a lot of time to do that. And it’s like an investment to travel here because it’s very expensive and the country is too big, haha. So my involvement with free software is like in my community. On our street where we work, a lot of people use Linux because of us. It’s like a center, you know? Time to time, someone goes there, “Oh, I bought a new notebook, I want to install Linux, let’s do it together”.
I think my part in this is more local than global – in the community. I feel better like this. Real connection, offline. I’m not so close to the development here and the other artists. And most of them, they’re just show artists. They don’t really work with design, they don’t really live from this, you know? I tend to know people who live from free software. Most of them are professionals, who are really good at one software, but they don’t put food on the table with it. It’s a little different. I learn from them, but I want to know people who have real issues.
Because when you don’t work with it, you just experiment, you make your own goals. Like “I’m going to make this girl have make-up on her face”, and then you do that. When you work, another person puts a goal on you. Like, “Make this girl have a guitar”, and you have to find a way to do that. And the process when you make a goal versus when another person makes a goal you have to achieve, it’s very different when you’re working with the software. Because you have to go somewhere you’ve never went before. And it makes you use the software in a different way.
You understand what I’m saying? Because when I see the workshops, people are very good at doing something they always do. I want to see people doing very good things they’ve never done before. These things show the real potential of the software.
Jehan: And the potential of the artist.
Nara: Yes, and the potential of the artist. Because you can show me, Inkscape or GIMP is doing this new thing. But maybe I’m not going to use it just because it’s in the software. I’m only will use it if I need it. So, there are a lot of people who are experts in the tools and what the tools can do – to make it, you have to use all the tools combined. It’s different, it’s another level.
Jehan: Well, I think that’s a good interview. Thank you Nara!
Nara: Thank you!